
Client
Verizon
Year
2019
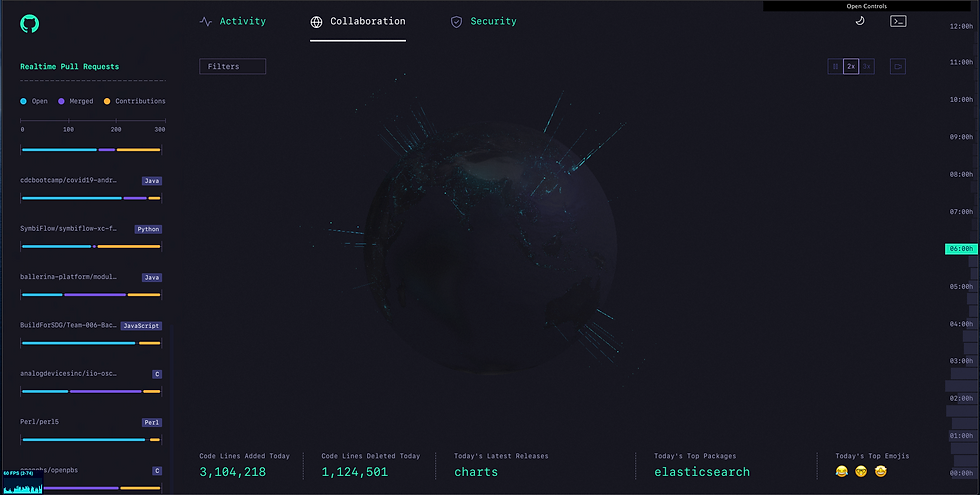
The Octoverse
We work with Github to develop a data visualization website that shows the daily activity on their platform. Daily lines of code added/removed, pull requests in real-time, and a globe that shows the physical distribution of the collaborators that creates all Github's data.
If you are interested in seeing the website please reach out
<Responsibilities />
-
Develop the UI and all non-theejs components for the website.
-
Develop multiple Chart components to reuse and display the data of each section, including bar charts, dot charts, area charts, and an interactable timeline.
-
Connect the API calls to the chart components.
-
Implement react routing.
-
Implement animations and transitions (fades and scramble text).
-
Develop the "orientation" and "not supported browser" interface.
-
Optimize UI components for optimal framerate.
-
Optimization for mobile and cross-browser.
-
Setup hosting and deploy the project.
<Tech />
-
React.js
-
JavaScript
-
Node.js
-
Three.js / Snap.svg / Gsap
-
Gcloud(Hosting)
<Client />
Github